The Swiss Far West and GPX fun
Yesterday my supervisor and I went to a hike to the Swiss Far West, the westernmost part of Switzerland. Unfortunately, we couldn’t go to the precise westernmost point of the border with France, because that’s in the middle of the river Le Rhône1 and we didn’t want to get inside the water.
I recorded our hike using OsmAnd, a very nice app for maps and location and finding out how to go from one place to another. And all that offline! You only need internet connection to download the app :) Oh, and it’s free!
The app gave me this GPX file. It’s basically an XML file with coordinates (latitude, longidute, elevation and time) and some more information. You can read more about the format on WikiPedia.
I found this gpxpy library to work with GPX files. It’s quite easy to use it together with matplotlib:
import gpxpy
import matplotlib.pyplot as plt
from matplotlib import animation
from mpl_toolkits.mplot3d import Axes3D

gpx_filename = "hike.gpx"

gps_lat = []
gps_long = []
gps_elevation = []

fig = plt.figure()
ax = fig.add_subplot(111, projection='3d')

with open(gpx_filename, 'r') as bla:
    gpx = gpxpy.parse(bla)
    for track in gpx.tracks:
        for segment in track.segments:
            for point in segment.points:
                gps_lat.append(point.latitude)
                gps_long.append(point.longitude)
                gps_elevation.append(point.elevation)


def init():
    N = len(gps_lat)
    for i in range(N - 1):
        ax.plot(gps_long[i:i + 2],           # x coordinate
                gps_lat[i:i + 2],            # y,
                gps_elevation[i:i + 2],      # z
                color=plt.cm.viridis(i / N)) # sequential color

    ax.set_xlabel("longitude")
    ax.set_ylabel("latitude")
    ax.set_zlabel("altitude (meters)")

    return fig,


def animate(i):
    ax.view_init(elev=10., azim=i)
    return fig,

anim = animation.FuncAnimation(fig, animate, init_func=init,
                               frames=360, interval=20, blit=True)
anim.save('hike.mp4', fps=30, extra_args=['-vcodec', 'libx264'])
And this codes gives the path of our hike, after about 150 seconds:
And that’s pretty cool 😎
Lets extract some more information about this GPX file, in Python:
import gpxpy

gpx_filename = "hike.gpx"
gpx = gpxpy.parse(open(gpx_filename))

print("")
print("distance:", gpx.length_3d(), "m")
print("duration:", gpx.get_duration(), "s")
print("started:", gpx.get_time_bounds()[0])
print("ended:",   gpx.get_time_bounds()[1])
print("elevation extremes:", gpx.get_elevation_extremes()[:], "m")
print("Max speed: ", gpx.get_moving_data()[-1], "m/s")
print("Boundaries: ", [bla for bla in gpx.get_bounds()])
Which gives:
$ python infos.py

distance: 5892.264830266586 m
duration; 5550 s
started: 2018-09-24 07:36:10
ended: 2018-09-24 09:08:40
elevation extremes: (320.36, 429.36) m
Max speed:  1.8713130924592616 m/s
Boundaries:  [46.1285393, 46.13805, 5.9561619, 5.9720922]
Nice! But the nicest thing would be a simple way to add the GPX coordinates on top of the map of the region. The library geotiler provides a way to get the map from OpenStreetMap. You might need Redis running as server in the background for geotiler to work. Here’s the code:
import matplotlib.pyplot as plt
from mpl_toolkits.basemap import Basemap
import matplotlib.patheffects as PathEffects
from matplotlib.patches import Ellipse
import geotiler
import gpxpy

gpx_filename = "hike.gpx"
gpx = gpxpy.parse(open(gpx_filename))

bbox = [gpx.get_bounds().min_longitude - 0.002,
        gpx.get_bounds().min_latitude  - 0.002,
        gpx.get_bounds().max_longitude + 0.002,
        gpx.get_bounds().max_latitude  + 0.002]

fig = plt.figure(figsize=(13, 13))
ax = plt.subplot(111)

# download tiles from OSM
mm = geotiler.Map(extent = bbox, zoom = 16)
img = geotiler.render_map(mm)

myMap = Basemap(llcrnrlon=bbox[0], llcrnrlat=bbox[1],
                urcrnrlon=bbox[2], urcrnrlat=bbox[3],
                projection='merc', ax=ax)
myMap.imshow(img, interpolation='lanczos', origin='upper')

# plot hike
points = gpx.get_points_data()
lon = [p[0].longitude for p in points]
lat = [p[0].latitude  for p in points]
index = [p.point_no for p in points] # to color sequentially each point

x, y = myMap(lon, lat) # map (long, lat) to (x,y) coordinates in plot
ax.scatter(x, y, c = index, s = 4, cmap='brg')

# add some texts and arrows with style
t1 = ax.annotate('France', xy=(.01, .96), xycoords='axes fraction',
                 horizontalalignment='left', fontsize = 20,
                 verticalalignment='bottom', fontname = 'monospace')
t2 = ax.annotate('Switzerland', xy=(.99, .96), xycoords='axes fraction',
                 horizontalalignment='right', fontsize = 20,
                 verticalalignment='bottom', fontname = 'monospace')
el = Ellipse((2, -1), 0.5, 0.5)
t3 = ax.annotate('Border', xy=(.61, .90), xycoords='axes fraction',
                 xytext=(.5, .96), textcoords='axes fraction',
                 horizontalalignment='center', fontsize = 20,
                 verticalalignment='bottom', fontname = 'monospace',
                 arrowprops=dict(arrowstyle="simple",
                                 fc="black", ec="none",
                                 patchB=el,
                                 connectionstyle="arc3,rad=0.3"))
t4 = ax.annotate("Switzerland's\nwestest point", xy=myMap(5.9559555, 46.1323555),
                 xytext=(.3, .42), textcoords='axes fraction',
                 horizontalalignment='center', fontsize = 20,
                 verticalalignment='bottom', fontname = 'monospace',
                 arrowprops=dict(arrowstyle="simple",
                                 fc="black", ec="none",
                                 patchB=el,
                                 connectionstyle="arc3,rad=0.3"))
for t in [t1, t2, t3, t4]:
    t.set_path_effects([PathEffects.withStroke(linewidth=5, foreground='w', alpha = 0.666)])


plt.savefig('map.png', quality = 100, bbox_inches = 'tight')
plt.close()
It reads the GPX file, gets the map of the region from OpenStreeMap, adds coloured points showing the path and some texts. The result:
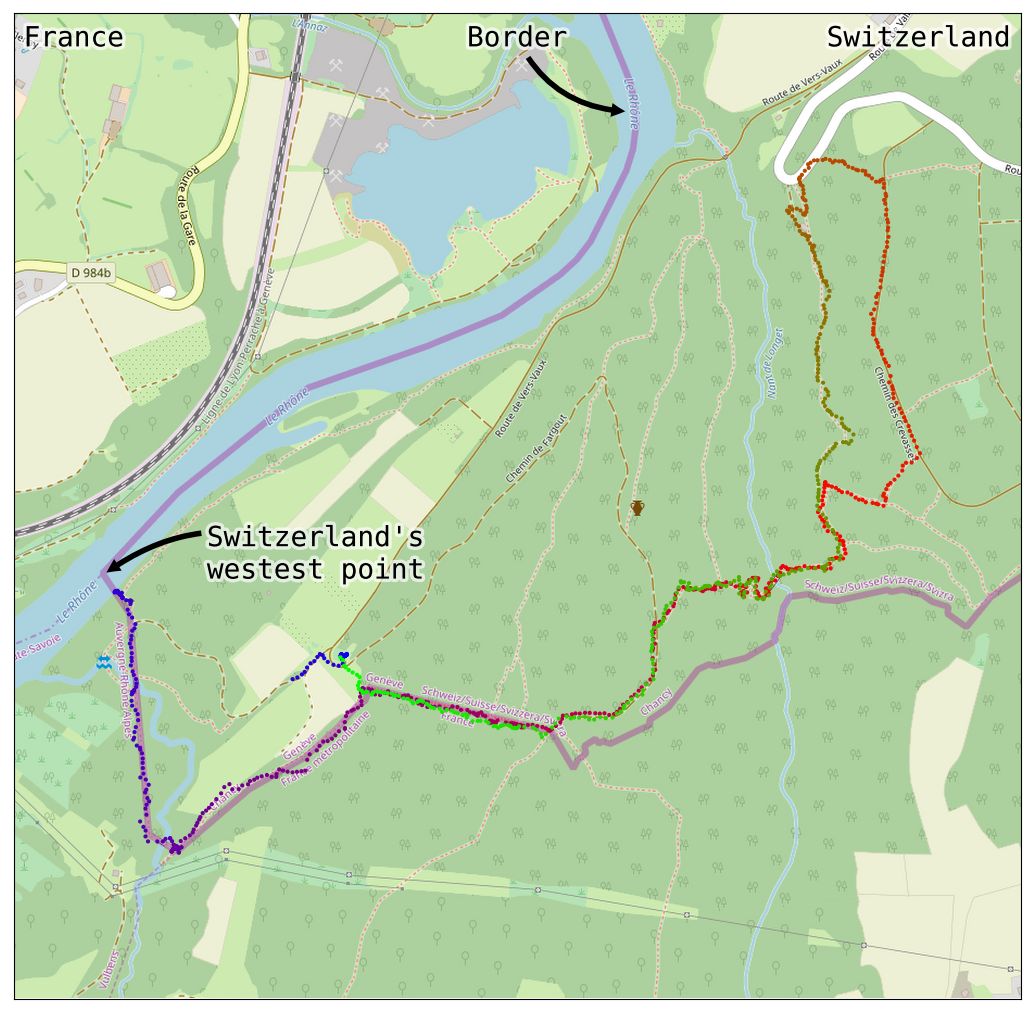
The blue points mark the beginning of the hike. And it changes colours all the way to the green points, marking the end of our 5892.3 meters walk :) As you can see, we got pretty close to the westernmost Swiss point! For some reason, my phone lost GPS connection in the beginning, that’s why it’s missing some blue points.
Footnotes: